
"At Gateshead Council, we are using Splink as part of a discovery project to create a single view of debt. The aim of the project is to reduce the time spent searching records across different systems and support different approaches to debt recovery. We have used Splink to match records from several datasets where there are no common identifiers for datasets that have existed for over 20 years. The results from Splink have been surprisingly positive; from manually reviewing the Splink output with real-world use cases, the clusters created show valid groupings of records. Whilst some clusters are not accurate, and sometimes randomly matched, further refinement of the underlying data and Splink parameters is mitigating these issues. The biggest challenge with Splink is finding a way to reliably evaluate the results at scale - thousands of clusters are being created and it is not possible to rely on manual review of the results. How we can more reliably evaluate Splink outputs is the focus of the next phase of our project."
-Nick Lamb, Service Design Lead -
Written by NICD Data Scientist Antonia Kontaratou
Introduction
One business problem that we frequently encounter at the National Innovation Centre for Data is the issue of 'entity resolution' and 'record linkage.' When dealing with large datasets, it's not uncommon to have multiple entries that refer to the same entity but lack a unique identifier. An entity can be an individual, an organisation, or any object with a distinct set of defining attributes. The task of determining which entries correspond to the same entity is referred to as 'entity resolution' (ER).
Beyond the complexity of having multiple occurrences of an entity within a single dataset, these entities may also appear across various data sources with variations in attributes. These variations can derive from differences in systems, changes in data collection methods, manual data entry errors, or simply due to individuals changing their information, like addresses.
In data products that necessitate a comprehensive understanding of entities across and within datasets, inferring semantic relationships and identifying similarities between records becomes an entity resolution challenge.
What has been the historical approach to solving this problem?
Traditionally, an entity resolution problem would be addressed by identifying a set of deterministic rules that could be applied to the attributes of entities. These rules were used to logically check whether two or more records referred to the same entity. However, this approach had some limitations. The number of hardcoded rules could escalate quickly given the volume and velocity of data, and it was likely that not all potential relationships could be accounted for.
How do modern approaches tackle the problem?
Modern approaches to entity resolution focus on using statistics and machine learning techniques. These methods aim to probabilistically capture similarities between entities. They are designed to help us accomplish several tasks, including the identification and removal of exact duplicates (deduplication), the linking of records that refer to the same entity (record linkage), and the standardisation of data representation within a system (canonicalization).
What is Splink and how can it help with entity resolution?
Driven by the need to link records of people accross different administrative data systems that lack a consistent unique identifier, the United Kingdom's Ministry of Justice (MoJ) developed Splink, an open source entity resolution Python package. Splink uses an unsupervised learning algorithm along with a set of use case-dependent heuristic rules to simplify the record linking process. It can be used both for the public and private sector as record linkage has a wide range of applications and is a cross-sector business problem that can add value to many organisations.
At the National Innovation Centre for Data, we first encountered Splink in December 2022, when we started co-organising the 'Public Sector Code-Along with Azure Databricks and MoJ's Splink' event that took place at the Catalyst at the end of January 2023. Since then, we have explored its potential and we are currently examining its application on an active skills transfer project to identify when multiple references point to the same entity, especially when attributes for each entity are not the same across references.
In this blog we will walk through an example of setting up Splink and applying it to a sample dataset. The dataset contains a list of individuals with some demographic information. The task is to identify which records refer to the same individual even though the information provided is not identical.
What steps are we going to follow?
Before diving into the code, it is worth presenting an overview of the process that we will follow which is aligned with how Splink's pipeline works.

Splink workflow
Steps:
- Install Splink
- Load, prepare and explore the data
- Train a Splink linker model on the available data
- Use the trained model for inference to extract groups (clusters) of observations that refer to the same entity
- Explore the clusters and their contained data
1. Install Splink
The first step is to install Splink, for which we can use either pip or conda. Simply uncomment the appropriate line depending on the package and environment manager of your choice.
! pip install splink # ! conda install -c conda-forge splink
2. Data preparation and exploration
Splink requires that data loaded to the library conforms to a particular set of standards which are presented below:
- Unique id: For every dataset there is a column with a unique identifier called
unique_id. - Consistent column names: The column names that refer to the same attribute are consistent across datasets. For example, if a column refering to the date of birth is named as
dobin one dataset anddate_of_birthin another, the names should be altered to match. - Clean data: Amongst other things, this includes: standard date formats, matching text case and handling of invalid or missing data in a consistent way. Special characters must also be removed and abbreviations should be replaced with full words.
For the purpose of this blog we will use a synthetic dataset provided by Splink that contains 1,000 entries. The dataset is required for running the blocks of code that follow and it is available through the library. Please note that this dataset already conforms to the Splink requirements mentioned above so we don't need to do any data pre-processing. In real applications the first step that we take when we start a data science project is cleaning the data and converting it to the right format for our task!
2a. Load and explore the data
We will load it using pandas and then do some exploratory data analysis (EDA) to understand the nature of it. We will also use some functionalities provided by Splink for data visualisation and summarisation that are helpful for understanding which columns could be useful for our record linking task.
The dataset contains 1,000 data points, with each having the following information about the individuals (null values are also possible):
- A unique identifier
unique_id first_name- the first name of the individual- The
surnameof the individual - The
dobof the individual - The
citywhere the individual resides - The
emailaddress of the individual - The
clusterof the individual
The cluster, which is the last column, is the ground truth, with each distinct cluster number denoting the same entity (individual). We will not use this column as this information is usually missing from real-life datasets due to the fact that this is what we actually want to identify - that is, which entries refer to the same entity in the dataset (deduplication of non-identical entries).
Let's load the data and look at the first rows.
 import pandas as pd
from splink.datasets import splink_datasets

df = splink_datasets .fake_1000
print(df.head(10))
print("The dataset's dimensions are (rows, columns): ", df.shape)
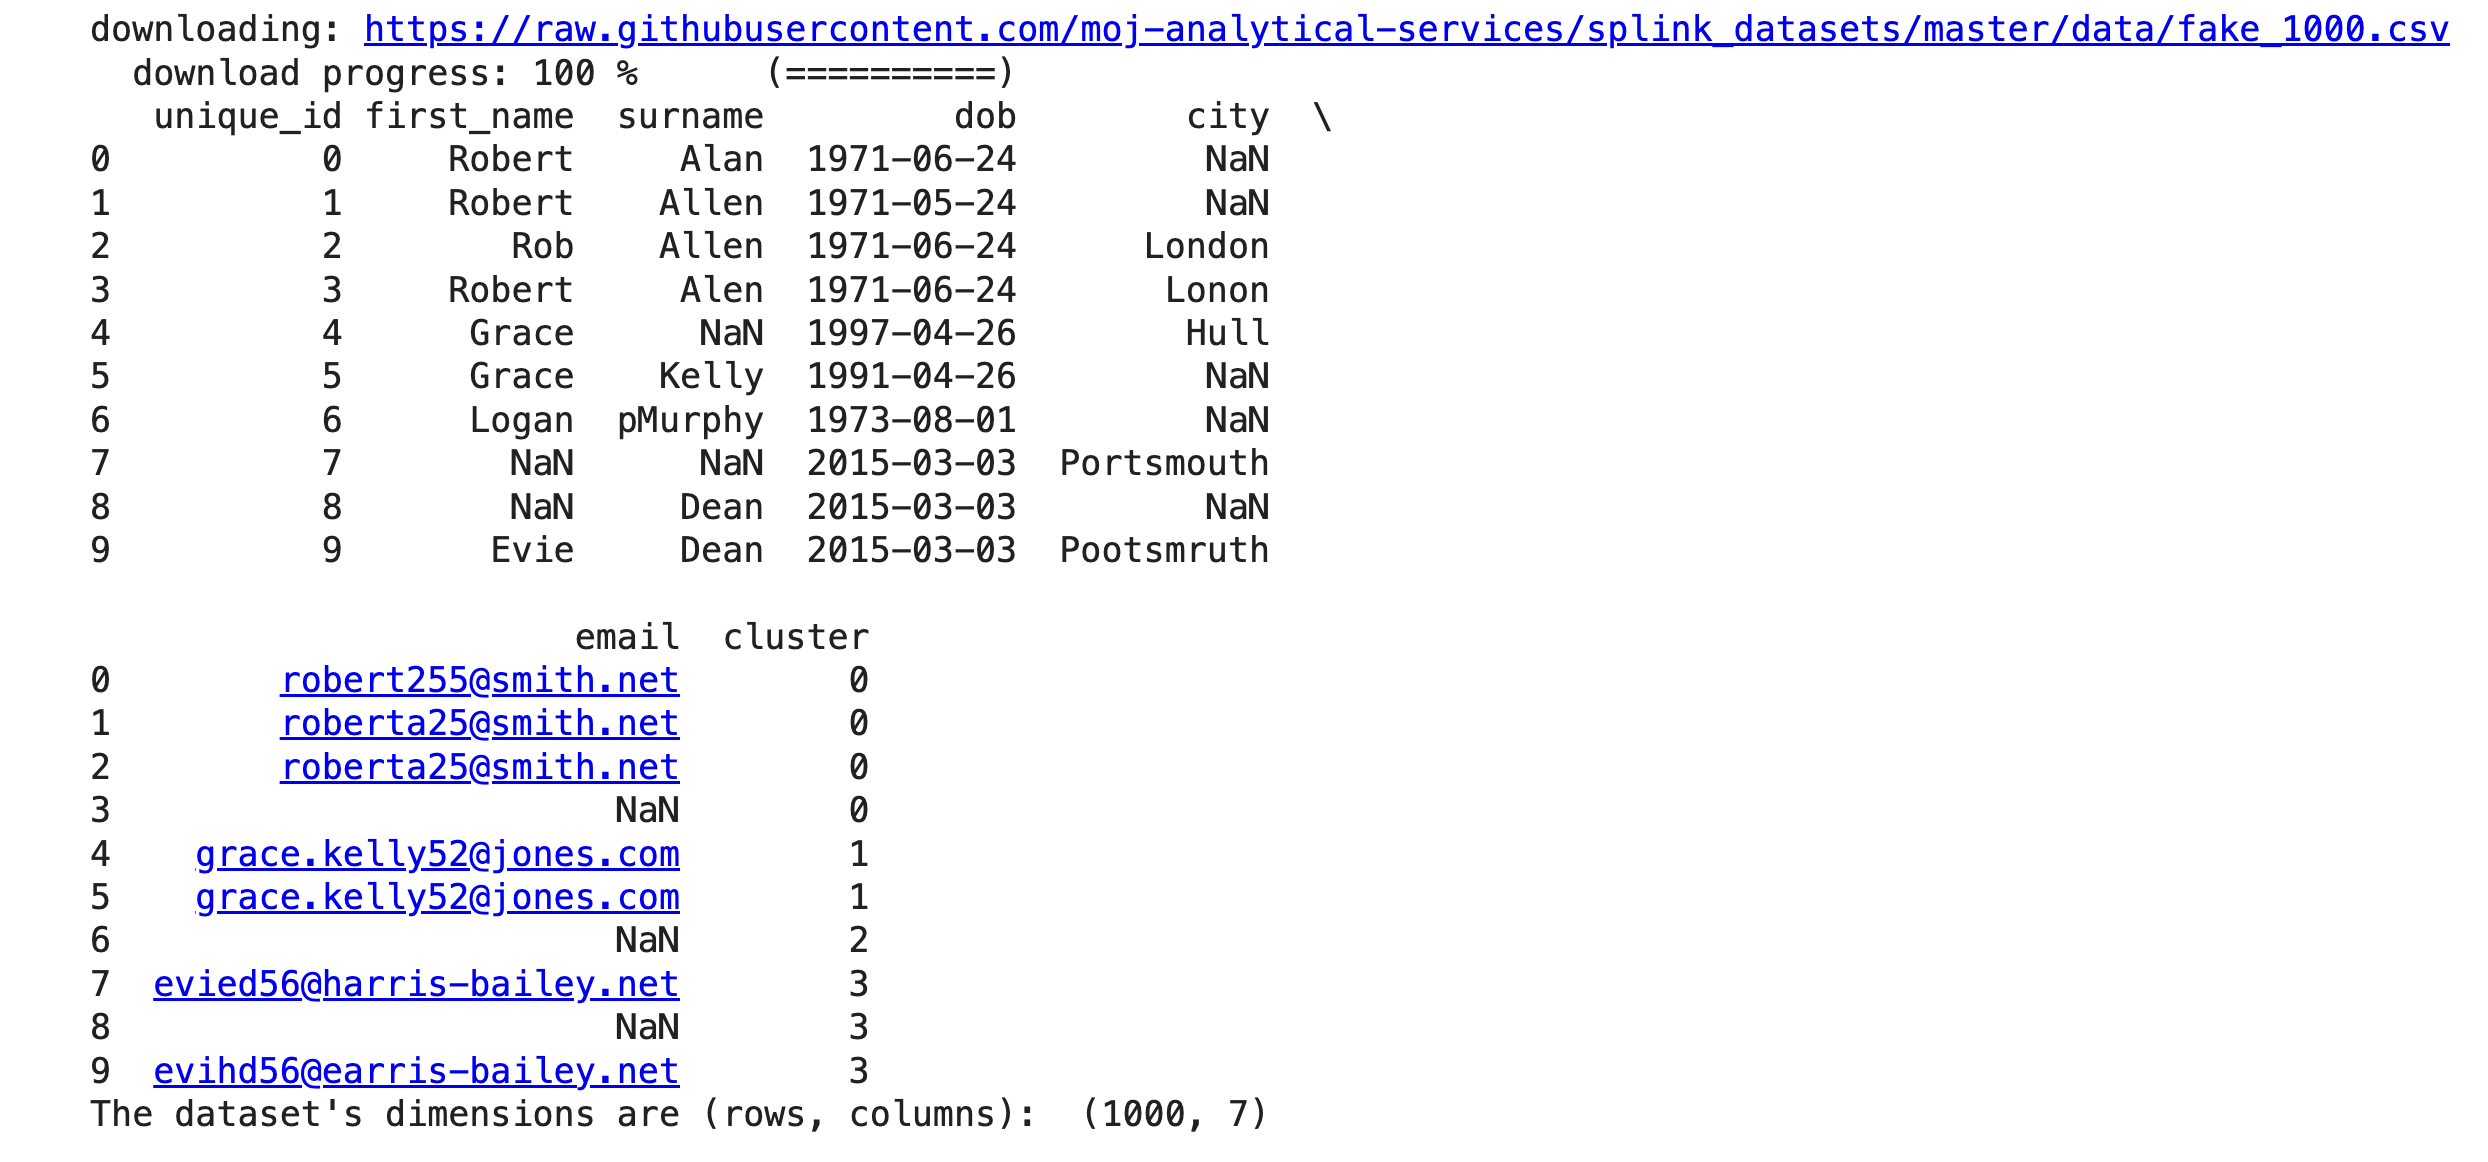
By looking at the first 10 rows we can see that it is likely that the first 4 entries refer to the same entity as the first and the last names are quite similar. Additionally, the date of birth is the same in three out of four entries, with the second entry potentially having a misstyping error for the month. The email address seems similar too, and the city is either not available or has a typo.
Using a library like Splink would help us automate the process of understanding similarities among records and link entries that refer to the same entities.
2b. Instantiate the linker
Splink uses a linker object containing methods that give users access to Splink's core functionalities. Hence, after loading the data, we instantiate a linker and pass in as argument the dataset we want to process along with a settings dictionary that contains useful information for the model (a more detailed explanation of this dictionary will be provided in later parts of this blog).
 # Initialise the linker, passing in the input dataset(s)
from splink.duckdb.duckdb_linker import DuckDBLinker
# We want to deduplicate the dataset, so we define the settings dictionary of the linker model respectively.
# Other link types are: link_only, or link_and_dedupe which are used for multiple datasets.
settings = {"link_type": "dedupe_only"}
linker = DuckDBLinker(df, settings)
While exploring the data and trying to understand which columns can be used for data linking, we can look at two main aspects: missingness and the distribution of values in the data.
Understanding the level of missingness in the data is very useful as columns with a lot of missing fields are not credible for linking records.
Analysing the distribution of values in the data is also important. Firstly, because columns with a higher number of distinct values (cardinality) are more useful for linking the data as they can more easily distinguish individual properties. Secondly, skewness in the data means that a value is very frequently repeated (e.g. 70% of the values in the city come from London) and it does not provide important information for entry differentiation.
2c. Analyse missingness
Columns with a lot of missing fields do not contain information that can identify individuals. Creating a Splink missingness_chart can depict this information.
 # We use the missingness_chart method of the linker object.
linker.missingness_chart()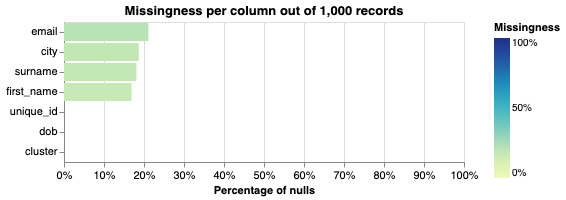
From the graph above we can see that email, city, surname and first_name contain a few missing values, with a level of missingness of less than 22%.
2d. Analyse the distribution of values
Here we check for cardinality and skewness as a high number of distinct values in a column suggests differentiation and linking evidence, and skewness suggests the opposite.
 # We use the profile_columns method of the linker object.
# We can check all columns together or select only the columns of interest.
# In the following line we profile all the columns (apart from the cluster that we are not using).
# For the date of birth we only extract the year.
linker.profile_columns(["first_name", "city", "surname", "email", "substr(dob, 1,4)"], top_n=10, bottom_n=5)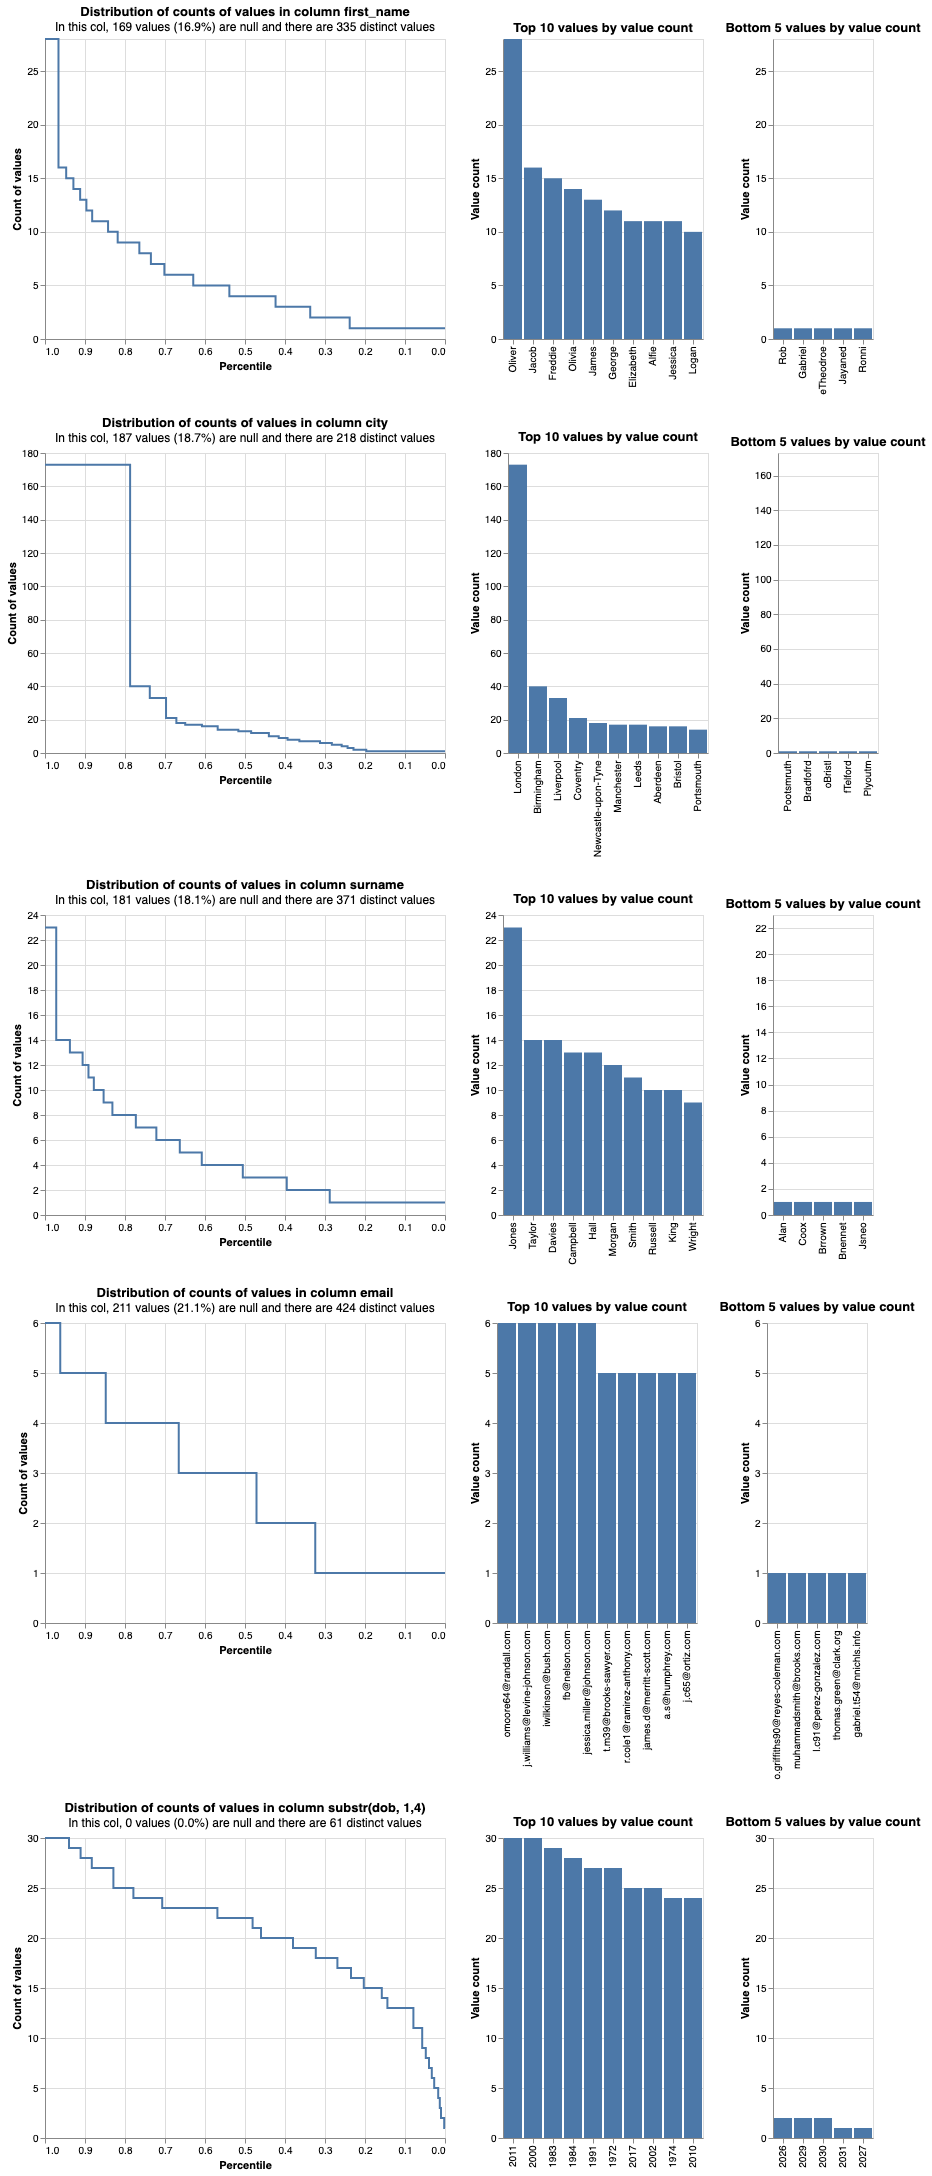
From the graphs produced for every attribute we can observe the following:
-
Skewness for
city: the data forcityare skewed towards 'London' as approximately 20% of the entries in the synthetic dataset come from this city. It is important to take this information into account in our linking model and assign different weights to cities depending on their frequency in the dataset. -
Skewness for
email: as the email address does not seem to be skewed it can be a good candidate to be used as a linking variable. -
Bottom 5 values by value count: indicates that there are many typos in the data in all columns. For example, we can see that there are future dates in the
dobcolumn.
3. Train the Splink model
Following data loading and initial exploration, we have to follow the steps mentioned below (which will be elaborated upon later) in order to provide Splink with some information about our perception of how entries that refer to the same individual could be linked. This preemptive information helps optimise the library's performance during training by reducing the volume of computations required. Our understanding of the data is informed by domain expertise and past experience working with the dataset. It is further enriched by the analysis that we did in the previous steps and the insights we got from observing the plots generated above.
So, the next steps we will take are as follows:
- Define the blocking rules: These are constraints in the attributes that create candidates for comparison.
- Define the comparison method: Decide which algorithm will be used for comparing string similarity.
- Provide an estimate of the probability that any two given pairs are a match.
3a. Define the blocking rules
At the heart of entity resolution lies the process of comparing pairs of records to check which pairs match and which do not. As you can imagine, pairwise comparisons between all rows can be computationally intensive, in particular for large datasets.
Splink offers a solution to mitigate this by allowing users to implement blocking rules. These rules specify the criteria that two records must meet in order to be considered good candidates for comparison.
Blocking rules play a pivotal role in generating candidate pairs of records for comparison. Subsequently, a probabilistic linkage model scores only these filtered candidate pairs to determine which should be linked. However, creating effective blocking rules is not an easy task. If the rules are very strict some valid links might be lost and never checked by the linkage model. On the other hand, if the blocking rules are very loose, we may still generate too many comparisons.
Blocking rules in Splink are defined using SQL expressions. Each rule is associated with the number of comparisons it generates. Splink recommends keeping the total number of comparisons under 20 million, particularly when working on standard laptops. These rules can also be grouped and applied together for efficiency.
To illustrate, let's explore how we can define two blocking rules and how we can group them.
 # Define the blocking rules. For each blocking rule we can see the number of comparisons it generates.

# Create the first blocking rule defining that both the initial of the first name and the surname must be the same between a pair,
# so that it is then scored for linkage by the probabilistic model.
blocking_rule_1 = "substr(l.first_name,1,1) = substr(r.first_name,1,1) and l.surname = r.surname"
count = linker.count_num_comparisons_from_blocking_rule(blocking_rule_1)
print(f"Number of comparisons generated by '{blocking_rule_1}': {count:,.0f}")

# Create the second blocking rule that applies a constraint to having exact email match
blocking_rule_2 = "l.email = r.email"
count = linker.count_num_comparisons_from_blocking_rule(blocking_rule_2)
print(f"Number of comparisons generated by '{blocking_rule_2}': {count:,.0f}")
We can also create lists of blocking rules as follows:
 blocking_rules = [blocking_rule_1, blocking_rule_2]
# Create a chart that shows the marginal (additional) comparisons generated by each blocking rule
linker.cumulative_num_comparisons_from_blocking_rules_chart(blocking_rules)
Then, we can add this list of blocking rules to the linker object settings by overwriting the previous settings definition (earlier defined when we first instantiated the linker), and update the linker as shown below. We also define that we want to retain the matching columns and the intermediate calculations.
 settings = {
    "link_type": "dedupe_only",
    "blocking_rules_to_generate_predictions": [
        "l.first_name = r.first_name",
        "l.surname = r.surname",
    ],
    "retain_matching_columns": True,
    "retain_intermediate_calculation_columns": True,
}

linker = DuckDBLinker(df, settings)
3b. Define the comparison methods for columns
Having explored the definition of blocking rules, it is now a good point to delve into the concept of "comparisons" in Splink.
In Splink, a "comparison" holds a specific meaning: it defines how data from one or more input columns is compared, using SQL expressions to assess similarity.
For instance, one "comparison" might be responsible for evaluating the similarity in a person's date of birth, while another "comparison" could focus on comparing other attributes like a person's name or location.
A model in Splink is constructed from multiple "comparisons," which collectively evaluate the similarity of all columns utilised for data linkage. Each "comparison" comprises two or more "ComparisonLevels," each of which defines distinct degrees of similarity among the input columns within that specific comparison.
As such ComparisonLevels are nested within comparisons as follows:
Data linking model:
- Comparison: Date of birth
- ComparisonLevel: Exact match
- ComparisonLevel: One character difference
- ComparisonLevel: All other
- Comparison: Surname
- ComparisonLevel: Exact match on surname
- ComparisonLevel: All other
Source: Estimating model parameters
In Splink there are multiple methods that can be used to compare strings, and some may be familiar from other fields. Two of the most commonly used are:
1. Exact match As its names suggests, exact_match is a method that checks whether two values that are being compared are exactly the same or not. It does not allow any tolerance for typos.
2. Levenshtein distance The levenshtein_at_thresholds method gives a measure of how similar two strings are or are not, by taking into account how many single-character edits (insertions, deletions or substitutions of characters) are required to change one string into the other. This method is useful to account for mistypings.
Let's use the Levenshtein distance in an example to measure the similarities between first names.
 import splink.duckdb.duckdb_comparison_library as cl

# Here we use the Levenshtein distance method on the first name, with a threshold of 2.
# The threshold indicates what measure of distance is considered a good match.
first_name_comparison = cl.levenshtein_at_thresholds("first_name", 2)
print(first_name_comparison.human_readable_description)
In this comparison rule we set the threshold to 2 and Splink will create three values for the similarity:
- Great match: if the compared values are an exact match
- Good match: if the compared values are not an exact match, but have a Levenshtein distance of at most 2
- Bad match: all others
Similarly to how we grouped blocking rules earlier on, we can create a list of comparison methods that we can add in the linker object settings by overwriting the previous settings definition and updating the linker as shown below. This is now the complete settings dictionary used for this example.
 # Complete settings dictionary
settings = {
    "link_type": "dedupe_only",
    "comparisons": [
        cl.exact_match("first_name"),
        cl.levenshtein_at_thresholds("dob", 1),
        cl.exact_match("city", term_frequency_adjustments=True),
        cl.levenshtein_at_thresholds("email"),
    ],
    "blocking_rules_to_generate_predictions": [
        "l.first_name = r.first_name",
        "l.surname = r.surname",
    ],
    "retain_matching_columns": True,
    "retain_intermediate_calculation_columns": True,
}

linker = DuckDBLinker(df, settings)
3c. Estimate the parameters of the model
The latest settings dictionary now holds all the specifications of our linkage model. It contains the blocking rules that apply constraints in terms of which entries will be checked by the model for linking, and the comparison methods that will be used to evaluate record similarity on various attributes.
Now, that we have specified our linkage model, we need to estimate the following:
a. The probability_two_random_records_match, which as the name suggests is the probability that two randomly selected records from the dataset will match.
b. The u values, which are the proportion of records that fall into each comparison (either with matching or not matching attributes) over all the non-matching records.
c. The m values, which are the proportion of records that fall into each comparison (either with matching or not matching attributes) over all the matching records.
The idea behind the need and calculation of these probabilities derives from Bayesian statistics. More details are available in this link.
The notion behind these parameters may seem complex, and luckily Splink offers some help on how to estimate them. Let's see how.
a. Estimate the initial probability_two_random_records_match
We require a method to initially provide Splink with a probability indicating the likelihood of two records constituting a match. In certain scenarios, this probability may be available; for instance, if you are linking two tables containing 10,000 records and anticipate a one-to-one correspondence, you can set this value to 1/10,000.
Unfortunatelly, usually this value is unknown as we do not know in advance how many records in a dataset are expected to be a match.
However, Splink can offer a reasonably accurate estimation of this probability. It achieves this by using a set of "deterministic rules" and "recall," which represents the proportion of true positives expected to be correctly identified through these rules.
These rules and recall metrics are provided by the user, who serves as the domain expert and has some prior knowledge of the data and associated expectations.
 deterministic_rules = [
    "l.first_name = r.first_name and levenshtein(r.dob, l.dob) <= 1",
    "l.surname = r.surname and levenshtein(r.dob, l.dob) <= 1",
    "l.first_name = r.first_name and levenshtein(r.surname, l.surname) <= 2",
    "l.email = r.email"
]

linker.estimate_probability_two_random_records_match(deterministic_rules, recall=0.7)
b. Estimate $u$
Recall that the $u$ is the probability of observing records that fall in each comparison and each comparison level over all the records that do not match.
- A probability $u$ for a comparison e.g. 'name' with two comparision levels:
- $u_{0}=Pr(name\ does\ not\ match|records\ don't\ match)$
- $u_{1}=Pr(name\ matches|records\ don't\ match)$
This can be estimated using Splink's estimate_u_using_random_sampling method. It works by sampling random pairs of records, since most of these pairs are going to be non-matches. Over these non-matches we compute the distribution of ComparisonLevels for each Comparison:
linker.estimate_u_using_random_sampling(max_pairs=1e6)c. Estimate $m$
The $m$ values are the proportion of records falling into each ComparisonLevel amongst truly matching records.
- A probability $m$ with two levels:
- $m_{0}=Pr(some\ attributes\ don't\ match|records\ match)$
- $m_{1}=Pr(some\ attributes\ match|records\ match)$
Splink uses an iterative algorithm known as Expectation Maximization (EM) to calculate these probabilities. Consequently, a minimum of two estimation passes is required. In the first pass, specific columns are "fixed," and the parameter $m$ is estimated for the remaining columns. Subsequently, in the second pass, the roles are reversed, where other columns are "fixed," allowing for the estimation of $m$ for the initially fixed columns. This iterative process ensures parameter estimates for $m$ are obtained for all comparisons.
The concept of "fixing" serves as a blocking rule to reduce the number of record comparisons generated.
Let's demonstrate:
 # We will first fix `name` and `surname` to match in order to estimate the other columns' m probabilities.
# Then we will fix the `dob`.
training_blocking_rule = "l.first_name = r.first_name and l.surname = r.surname"
training_session_fname_sname = linker.estimate_parameters_using_expectation_maximisation(training_blocking_rule)
# Now we fix the `dob` in order to estimate the m probabilities for the remaining variables
training_blocking_rule = "l.dob = r.dob"
training_session_dob = linker.estimate_parameters_using_expectation_maximisation(training_blocking_rule)3d. Visualise model parameters
To understand the model's comprehension of relationships and its future predictive capabilities regarding whether two records refer to the same entity, Splink offers visual charts illustrating the contribution of each component to an actual match.
 # The final estimated match weights
linker.match_weights_chart()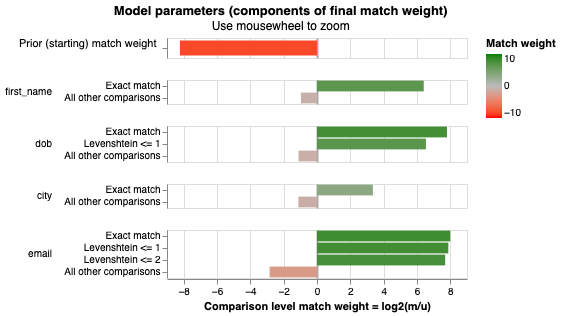
When you run the cell and you hover over the bars in the chart above, it provides insights into how each comparison level and attribute contributes to the model's assessment of a potential match. For instance, let's take the variable "dob" and its comparison levels in the graph as an example. When the date of birth is an exact match between two rows, the likelihood of those entries referring to the same entity increases by approximately 222-fold (please note that since this is a probabilistic model you might get a different number here). If the dates of birth differ by just one character (with a Levenshtein distance of <= 1), the likelihood of these entries referring to the same person is boosted by a factor of 92. On the contrary, if the dates of birth do not align, the probability of these entries referring to the same entity decreases by roughly half.
3e. Saving the model
Having successfully trained the model using our domain expertise and evidence from the dataset, we can now store the parameter estimates for the model, including (m) and (u), along with the settings dictionary. This enables us to load the model at our convenience whenever we need it for making predictions.
Please open the json file after you run the following line of code to get a better understanding of the parameters that have been saved.
 # Save the model.
settings = linker.save_settings_to_json("./saved_model_from_demo.json", overwrite=True)
4. Inference: Making predictions using our model
With our model in place, we can now make predictions to identify potential duplicates in our dataset. This will return a pandas dataframe with pair-wise comparisons between individuals in our dataset.
If we wanted to load the saved model and run our predictions we could do so as follows (after instantiating a linker):
linker.load_settings_from_json("./demo_settings/saved_model_from_demo.json")
Here, we already have the linker instantiated from having run the previous blocks of code so we can simply call predict().
Under the hood, predict() does the following:
-
Uses the blocking rules defined in the settings (also available in the saved model) to determine which records will be compared.
-
Uses the comparisons to compare the records.
-
Uses the estimated parameters to produce the final
match_weighandmatch_probabilityscores.
To reduce the number of rows we print out, we can also pass a threshold_match_probability so we only display matches with a linkage probability above a certain desired threshold.
 # Estimate the predictions
df_predictions = linker.predict(threshold_match_probability=0.2)
# Convert the first 10 predictions to pandas dataframe
df_predictions.as_pandas_dataframe(limit=10)
Clustering
The result of linker.predict() is not very informative as it does not create groups/clusters of the individuals that are linked together.
This is easy to implement by calling the built-in method cluster_pairwise_predictions_at_threshold as displayed below.
The cluster_id provides information about how the entries are grouped. Observations with the same cluster_id are believed by the model to refer to the same individual.
 clusters = linker.cluster_pairwise_predictions_at_threshold(df_predictions, threshold_match_probability=0.5)
clusters.as_pandas_dataframe(limit=10)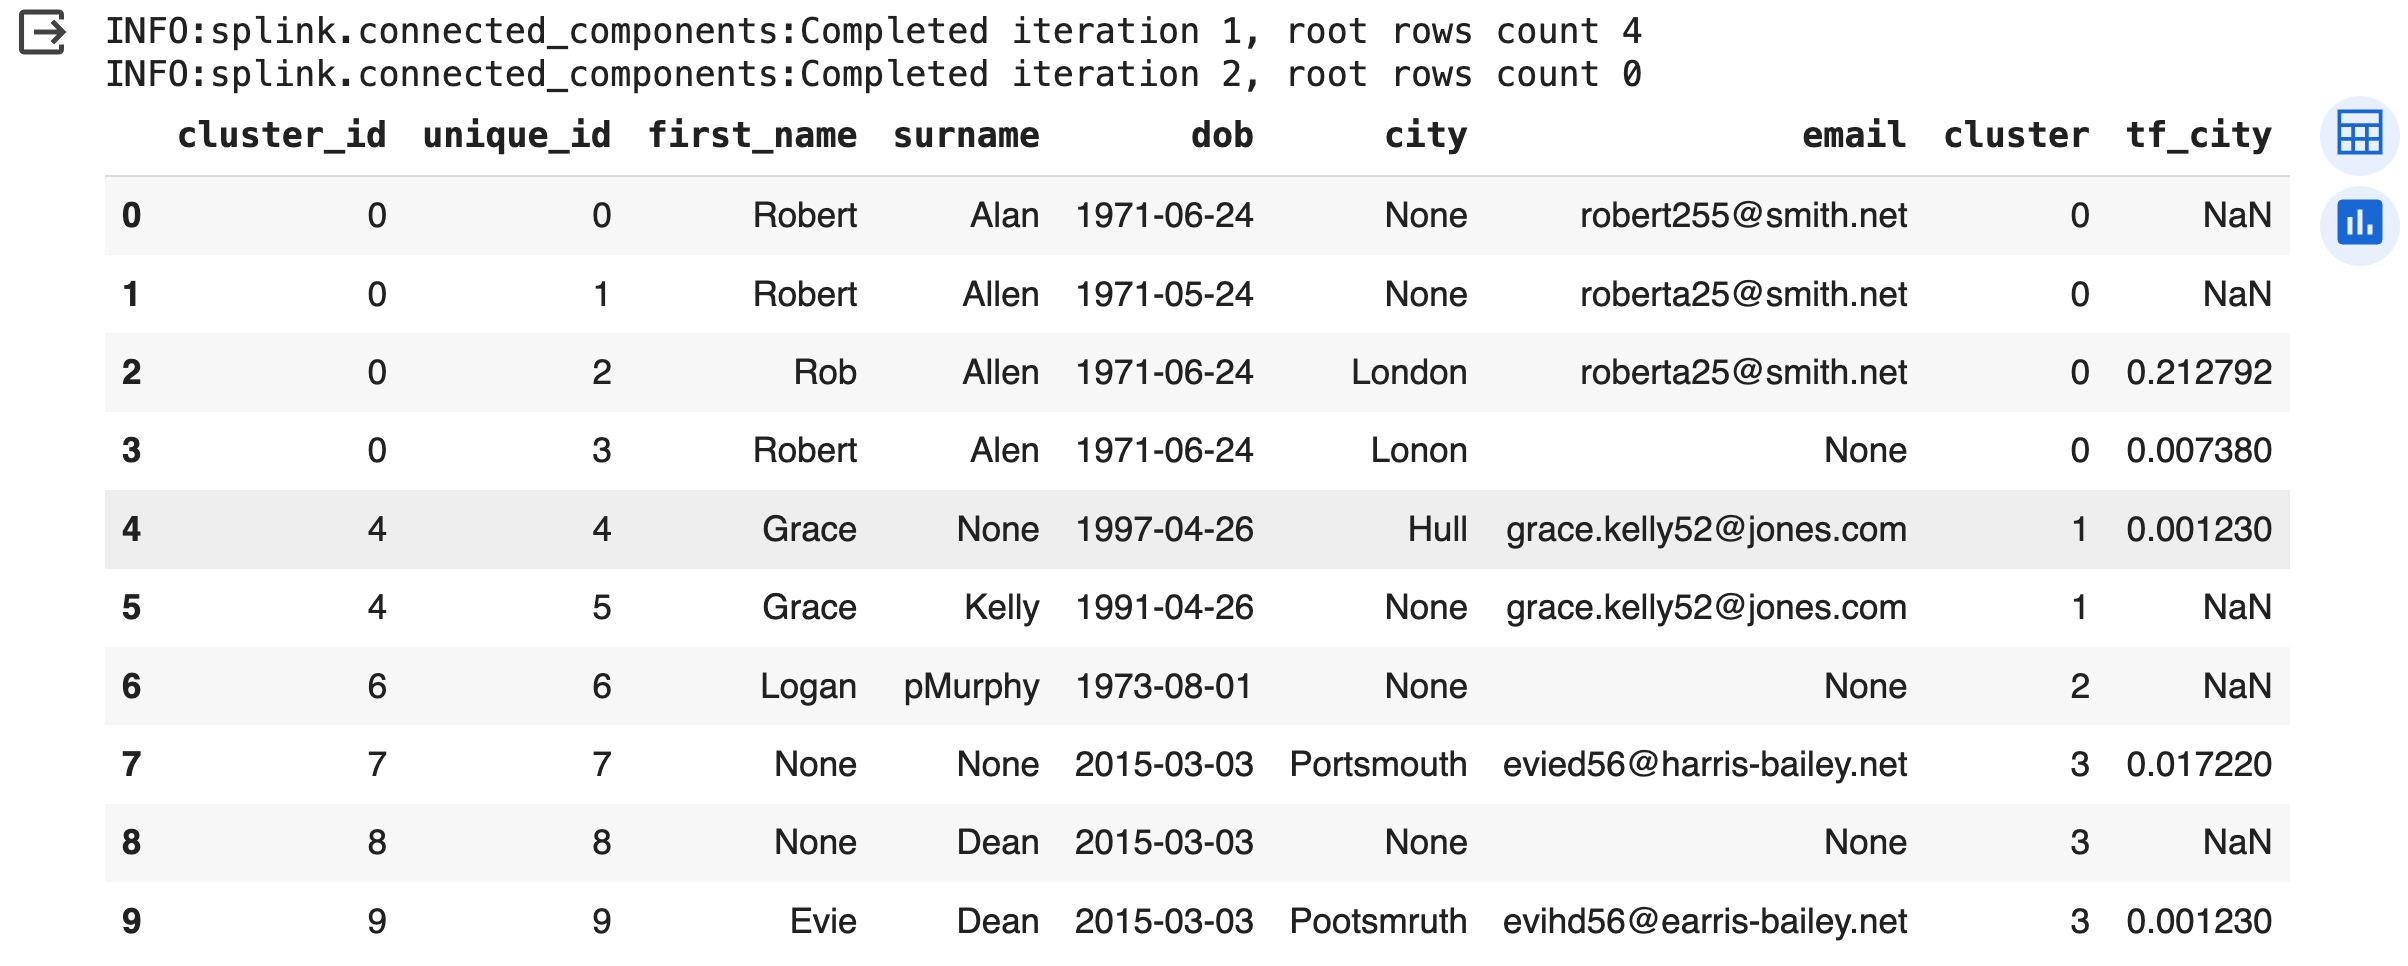
As shown by the results, Splink effectively identifies that the initial four records pertain to the same individual, which we know is true. Similarly, after exploring the results further we can confirm that other individuals were also correctly identified. Hence, it is worth exploring Splink for entity resolution and record linkage.
Limitations
Splink holds potential for utilisation in the fields of entity resolution and record linkage. However, effectively defining blocking rules, comparisons, and deterministic rules that reflect our prior knowledge concerning the likelihood of two records constituting a match, as well as our expected confidence (as indicated by recall), relies greatly on domain expertise and a profound comprehension of the business problem and the data.
Furthermore, the requirement for users to manually call relevant methods to estimate model parameters could be ommitted with an enhanced API. This improved interface would automate the sequence of method calls under the hood once users input the necessary details, such as the deterministic rules needed for initial probability estimation regarding the matching of random records.
Splink is an active project that is continuously evolving, so there is a possibility that some of these limitations will be addressed in the near future.
Conclusion
Splink seems to exhibit good performance in the domain of record linkage and entity resolution. In our current skills transfer project where Splink is being used it did well in successfully creating accurate clusters after parameter adjustments and careful result exploration and evaluation. These optimisations helped us identify the optimal parameters for our specific dataset, ultimately leading to better clustering results. However, we did encounter one cluster that seemed to contain random entries, which suggests that further exploration and refinement may be necessary. This emphasises the need for adaptability and ongoing improvement when dealing with real-world data, as well as tool exploration and understanding.
Find out more
If you want to find out more, the Splink website includes tutorials, documentation and examples.
The National Innovation Centre for Data is always open to exploring collaboration opportunities. If entity resolution is a challenge your organisation is currently tackling, please don't hesitate to reach out to us. We'd be delighted to discuss how we can assist you in consolidating your data and gaining a holistic perspective.
Dr Antonia Kontaratou is a Data Scientist at the National Innovation Centre for Data. Her technical background combines statistics and computer science. Her PhD focused on scaling Bayesian modelling techniques. She is interested in machine learning and she is currently programming in R and Scala.


