Introducing the first in our new Data Deep Dive series, Creating PDF reports with ReportLab and Pandas, written by NICD Data Scientist Fergus McClean
Introduction
Creating PDF reports based on data is a common but often painstaking task for many businesses. Building automated workflows to generate these reports can provide clear time savings and thus add value as more data can be aggregated and reported more quickly and frequently. However, there is no simple and widely applicable solution to this problem. Here, I present one possible solution using open source software.
For the purposes of this article, I am going to assume that you are already familiar with the Python programming language and its main library for dealing with tabular data, Pandas. If not, however, the W3Schools tutorials on Python and Pandas are a great place to start.
The main focus here will be on using ReportLab to generate a PDF from figures created using Pandas, however other libraries might also be used to generate the figures. We’ll cover:
- Installation
- Creating the document template using Platypus
- Defining conversion functions to create figures and tables
- Adding content
ReportLab “create solutions to generate rich, attractive and fully bespoke PDFs at incredible speeds”. They provide both commercial and open source offerings. Here, I will focus on the open source Python library. This is used by MediaWiki (the platform behind Wikipedia) to create PDF versions of articles.
Things I like about ReportLab:
- Everything happens in Python and there is no need to work with multiple files
- Support for changing page size within documents
- Rendering is fast
- The Platypus layout engine
Things I don’t like about ReportLab:
- Objects get modified in place when building a document. This can become a problem when running in a notebook where objects were created in previous cells and don’t necessarily get recreated when only running the cell which builds the document.
- Errors are often difficult to interpret
- Camel case is used instead of snake case
- The documentation is only available in PDF format and it can be difficult to find what you’re looking for
But there are other tools available. For example, Plotly can be used to generate HTML pages containing graphs and tables which can then be converted to PDF. This is handy if you are already using Plotly to create your figures, however, this does not give you any control over what goes on which page as HTML has no concept of pages as such. Also, you will need to know some HTML to get this working. Another way of creating PDF reports from Python is to use PyFPDF. However, as their documentation demonstrates, PyFPDF does not provide a flexible page layout engine. Again, this means you have to specify what goes on which page. This may be manageable in your use case, but I personally find it much easier to provide a list of content and have the pages be created automatically (similar to what MS Word does).
Installation
The recommended way to install ReportLab is using PyPI
pip install reportlab==3.6.*To create tables and figures, we will also need Pandas and Matplotlib:
pip install pandas matplotlibCreating the document template using Platypus
We will use the Platypus layout engine to do most of the work of laying out our PDF.
Platypus stands for “Page Layout and Typography Using Scripts”. It is a high level page layout library which lets you programmatically create complex documents with a minimum of effort.
If you want to use ReportLab without Platypus, you will need to manually position your content. This may be appropriate in some use cases but, in the majority of cases, using Platypus will make your life easier.
The first thing you will want to do is create some frames.
A frame is a region of a page that can contain flowing text or graphics
Frames are used to decide how much content can fit on each page. I have created two frames, one for portrait pages and one for landscape:
from reportlab.platypus import Frame
from reportlab.lib.pagesizes import A4, landscape

padding = dict(
  leftPadding=72,
  rightPadding=72,
  topPadding=72,
  bottomPadding=18)

portrait_frame = Frame(0, 0, *A4, **padding)
landscape_frame = Frame(0, 0, *landscape(A4), **padding)
The first and second arguments of the Frame class are the x and y coordinates of the lower left corner of the frame. These are followed by the width and height of the frame, information which can be obtained from the page size object (A4). Finally, the padding in each direction can be specified. I have set the padding to be the same in both frames, but this doesn’t always need to be the case.
Next, create a function that will be called (calling a function runs the block of code it contains) on each page. This can be used to add logos and page numbers, for example. Notice that the location of the page number and image need to be manually specified and that they don’t sit within a frame. I have created two versions of the function, one for each page size, as I wasn’t able to work out how to get the current page size within the function. The landscape function conveniently converts the A4 page size to be landscape.
def on_page(canvas, doc, pagesize=A4):
    page_num = canvas.getPageNumber()
    canvas.drawCentredString(pagesize[0]/2, 50, str(page_num))
    canvas.drawImage('https://www.python.org/static/community_logos/python-logo.png', 0, 0)

def on_page_landscape(canvas, doc):
  return on_page(canvas, doc, pagesize=landscape(A4))
This function can be combined with frames to create page templates.
A page template can contain one or more frames
It is important to specify an ID for each of these page templates as this will be used later to switch between them. Notice that different onPage functions are used in each template, as mentioned above. A single frame, created above, is used to create each template.
from reportlab.platypus import PageTemplate

portrait_template = PageTemplate(
  id='portrait',
  frames=portrait_frame,
  onPage=on_page,
  pagesize=A4)

landscape_template = PageTemplate(
  id='landscape',
  frames=landscape_frame,
  onPage=on_page_landscape,
  pagesize=landscape(A4))
These page templates can be combined into a document template, which also specifies the name of the file to create. You can only have one document template per document as this is the top-level container. The best way to think about it is that there is always a single document template, which can contain one or more page templates, each of which can contain one or more frames.
from reportlab.platypus import BaseDocTemplate

doc = BaseDocTemplate(
  'report.pdf',
  pageTemplates=[
    portrait_template,
    landscape_template
  ]
)
Defining conversion functions
To be able to insert Matplotlib figures and Pandas DataFrames into reports, they’ll need to be converted into ReportLab Images and Tables. To convert figures in memory, I’m using the io library and creating a binary stream. I then save the figure as a PNG to this binary stream and seek to the beginning of the stream. You could also store save them as vector graphics (SVG), however ReportLab is not able to handle these out of the box and you will need to use Svglib.
The ReportLab Image class requires the image size in pixels. Matplotlib figures have a get_size_inches method and the output of this can be easily converted to pixels using the inch object from ReportLab. Depending on the figure, it may be necessary to call tight_layout before converting it to an Image. You could also save these images to disk and then load them again, but I personally think it’s simpler and easier to do everything in memory. It also avoids having to deal with file names and potential write permission issues.
import io
from reportlab.platypus import Image
from reportlab.lib.units import inch

def fig2image(f):
    buf = io.BytesIO()
    f.savefig(buf, format='png', dpi=300)
    buf.seek(0)
    x, y = f.get_size_inches()
    return Image(buf, x * inch, y * inch)
To convert DataFrames to Tables, you will first need to convert all the columns to Paragraphs. This ensures that the text can wrap in the title row, which is helpful for long column names. The title row can be added to the values from the DataFrame as a list. The result is a list of rows, with each row being a list of values. The DataFrame index is not used here, but you could incorporate it if you wanted to. The style argument can be used to set fonts, backgrounds and borders. In this example, the table will have alternating grey and white backgrounds and borders around all cells. There is a detailed description of how table styling works in the documentation but I won’t go into it here.
from reportlab.platypus import Table, Paragraph
from reportlab.lib import colors

def df2table(df):
    return Table(
      [[Paragraph(col) for col in df.columns]] + df.values.tolist(),
      style=[
        ('FONTNAME', (0,0), (-1,0), 'Helvetica-Bold'),
        ('LINEBELOW',(0,0), (-1,0), 1, colors.black),
        ('INNERGRID', (0,0), (-1,-1), 0.25, colors.black),
        ('BOX', (0,0), (-1,-1), 1, colors.black),
        ('ROWBACKGROUNDS', (0,0), (-1,-1), [colors.lightgrey, colors.white])],
      hAlign = 'LEFT')
I have created a single function each for tables and figures but you could have multiple. This would allow, for example, certain tables to be styled differently.
Adding content
To create some images and tables, we’re going to use the famous Iris dataset. This dataset describes various features of 150 iris plants. I read this dataset using Pandas and then aggregate the features of plants by type, storing this as a new DataFrame (plant_type_df). Notice that the variable name is suffixed with _df to make it easier to distinguish from figures. I then create a figure with a unique name (plant_type_fig) using plt.subplots and plot the plant_type_df onto this figure as a bar plot. Notice that the figure variable name is suffixed with _fig to make it easier to distinguish from DataFrames. Both the figure and DataFrame can be used later when building the report. If you have many figures and DataFrames, it’s important to use easily understandable variable names.
import pandas as pd
import matplotlib.pyplot as plt

df = pd.read_csv('https://archive.ics.uci.edu/ml/machine-learning-databases/iris/iris.data', names=['sepal_length', 'sepal_width', 'petal_length', 'petal_width', 'plant_type'])

plant_type_df = df.groupby('plant_type').mean()

plant_type_fig, ax = plt.subplots(dpi=300)
plant_type_df.plot.bar(rot=0, ax=ax)
plt.ylim(0, 8)
plt.show()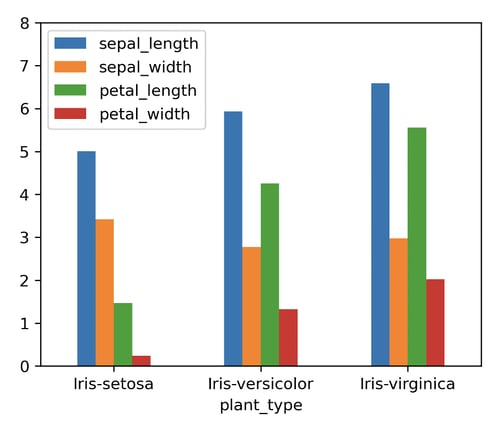
We can create mode figures and tables like so:
scatter_matrix_fig, ax = plt.subplots(dpi=300, figsize=(7, 7))
pd.plotting.scatter_matrix(df, ax=ax)
plt.tight_layout()
plt.show()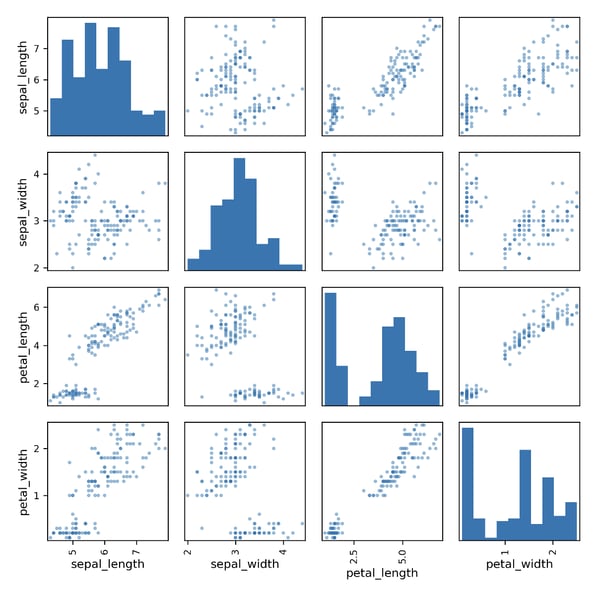
Now, let’s build the report! The figures and DataFrames that we made earlier can be converted using the appropriate conversion functions and included in a list called story. To switch between templates, set the next page template and then create a page break. You can then add titles and paragraphs using the Paragraph class. These can be styled using the sample style sheet provided by ReportLab, or you can create your own styles. Unnamed DataFrames can also be created and used within the story. For example, I call the corr method of df to get a DataFrame with the pairwise correlations and then convert this to a table.
Notice that I am not creating the ReportLab Image and Table objects earlier in my script. This is because these objects will be modified by ReportLab when the document is built and therefore if you are running in an interactive environment like a notebook, this may result in unexpected behaviour if you try and build the document without running the code which creates them.
Once you are happy with your story, pass it to the doc.build function and your report will be ready in no time!
from reportlab.platypus import NextPageTemplate, PageBreak
from reportlab.lib.styles import getSampleStyleSheet

styles = getSampleStyleSheet()

story = [
  Paragraph('Iris Dataset Report', styles['Heading1']),
  Paragraph('Scatter Matrix', styles['Heading2']),
  fig2image(scatter_matrix_fig),
  Paragraph('Pairwise Correlation', styles['Heading2']),
  df2table(df.corr()),
  NextPageTemplate('landscape'),
  PageBreak(),
  Paragraph('Mean Features by Plant Type', styles['Heading2']),
  fig2image(plant_type_fig),
  df2table(plant_type_df),
]

doc.build(story)
Here is a link to the report we created.
Summary
We have built a PDF report containing figures and tables using ReportLab and Pandas. This process is easily reproducible for other datasets and could be automated for producing reports on a regular basis. While there are other Python libraries available, I believe ReportLab provides great potential for fine-grained control over your reports and adding new content is simple once everything is set up. Getting started can be tricky due to the many types of object involved (document templates, page templates, frames, images, tables, and so on), but but hopefully the above example should help you on your way. If you work at a company which would like to automate their reports but doesn’t know where to start, why not run a data skills project with us?
This article was built using Quarto, you can see the source code HERE.
Dr Fergus McClean is a Data Scientist at the National Innovation Centre for Data specialising in, among other things, data engineering and visualisation. He has a background in environmental modelling and his PhD investigated the impact of using global datasets for flood inundation modelling and involved designing a cloud-based framework for running simulations.
Want to know more? Attend of Data Innovation Showcase
Join Fergus at our Data Innovation Showcase on the 27 September for a practical workshop where we'll walk you through the process of automating your first report and provide inspiration to optimise your own reporting workflows. No prior coding experience is needed.
Learn more about the session by exploring the conference programme.